---
title: "What is Cohort Analysis, and how CX teams use it to reduce churn"
description: "Learn what cohort analysis is and how CX teams use it to cut churn, spot at-risk segments, and turn support data into retention wins."
canonical: "https://sleekflow.io/en-sg/blog/cohort-analysis"
html_lang: "en-sg"
date_modified: "2026-07-21T07:47:52.463Z"
og_title: "Cohort Analysis for CX Teams to Reduce Churn"
og_description: "Learn what cohort analysis is and how CX teams use it to cut churn, spot at-risk segments, and turn support data into retention wins."
og_image: "https://images.ctfassets.net/tu2uwzoyozk8/jv7U36Ukh9EPuG26vYfRg/37254a153c2feca5c6b003922293bf06/Website-Cover-SleekFlow.jpg?w=1200&q=90"
---
```json
{
"@context": "https://schema.org",
"@type": "Article",
"headline": "Cohort Analysis for CX Teams to Reduce Churn",
"description": "Learn what cohort analysis is and how CX teams use it to cut churn, spot at-risk segments, and turn support data into retention wins.",
"url": "https://sleekflow.io/en-sg/blog/cohort-analysis",
"dateModified": "2026-07-21T07:47:52.463Z",
"image": "https://images.ctfassets.net/tu2uwzoyozk8/jv7U36Ukh9EPuG26vYfRg/37254a153c2feca5c6b003922293bf06/Website-Cover-SleekFlow.jpg?w=1200&q=90",
"breadcrumb": {
"@type": "BreadcrumbList",
"itemListElement": [
{
"@type": "ListItem",
"position": 1,
"name": "Home",
"item": "https://sleekflow.io/en-sg"
},
{
"@type": "ListItem",
"position": 2,
"name": "Blog",
"item": "https://sleekflow.io/en-sg/blog"
},
{
"@type": "ListItem",
"position": 3,
"name": "Cohort Analysis for CX Teams to Reduce Churn",
"item": "https://sleekflow.io/en-sg/blog/cohort-analysis"
}
]
}
}
```
# What is Cohort Analysis, and how CX teams use it to reduce churn
*Julian Wong — Content Strategist*
## Summary
- Cohort analysis groups customers by a shared starting point and tracks their behaviour over time, unlike aggregate metrics that hide why retention slides.
- A 5% improvement in retention can lift profits by 25% to 95%, the kind of swing that makes the right cohort split worth finding.
- Interaction cohorts, grouping customers by channel and depth of engagement, are the least-covered but most useful type for messaging-led support teams.
- Running a cohort analysis means picking a CX question first, then a 60-to-90-day window, since support outcomes take longer to show up than product changes.
- Continuous, automated cohort monitoring catches a service failure before quarterly reviews would even see it.
## **What is cohort analysis?**
Cohort analysis is a customer analytics method that groups people by a shared starting point, such as signup date, channel, or support experience, then tracks how each group's behaviour diverges over time. For CX teams, it replaces the aggregate score with a side-by-side view of which experiences drive people to stay or leave.
Instead of asking "what is our retention rate this quarter," you ask "how does the retention curve of customers who joined in March compare with those who joined in April," a more diagnostic question.
This differs from simple segmentation, which slices customers by static attributes (industry, plan tier, region) at a single point in time. A cohort adds the time dimension: it watches a group's trajectory rather than taking a snapshot, which is what makes it useful for spotting when a group starts to disengage.
## **Why cohort analysis matters for customer experience teams**
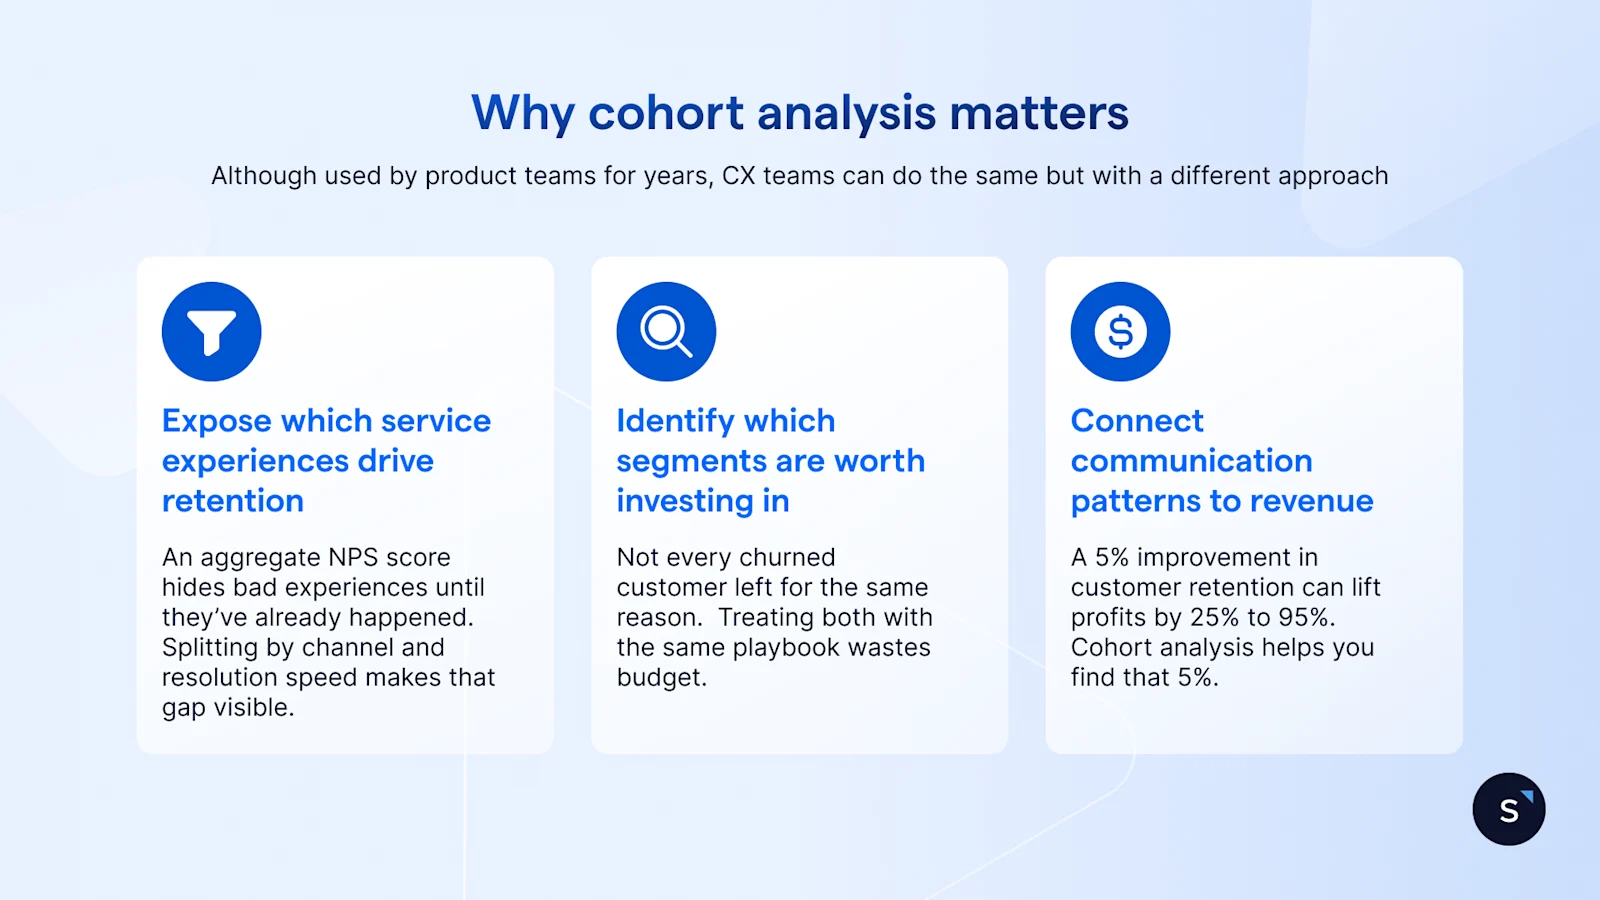
Product teams have used the method for years to track feature adoption; CX teams need the same approach built around service quality, channel, resolution speed, and response time, not product usage.
### **It exposes which service experiences drive retention**
An aggregate NPS score hides the fact that customers resolved within four hours on WhatsApp can retain at a dramatically different rate than customers left waiting over a day on email. Splitting by channel and resolution speed makes that gap visible.[ PwC's research](https://www.pwc.com/us/en/services/consulting/library/consumer-intelligence-series/future-of-customer-experience.html) found that 32% of customers will walk away from a brand they love after just one bad experience, the kind of drop an aggregate score hides until it has already happened.
### **It identifies which segments are worth investing in**
Not every churned customer left for the same reason. A cohort of enterprise accounts that never finished onboarding behaves nothing like a cohort of small business customers who churned after one support ticket. Treating both with the same playbook wastes budget.
### **It connects communication patterns to revenue**
According to[ Bain & Company](https://www.bain.com/insights/retaining-customers-is-the-real-challenge), a 5% improvement in customer retention can lift profits by 25% to 95%, depending on the industry. This kind of analysis is how a CX team finds its own version of that 5%, rather than applying someone else's playbook.Co
## **The four types of cohort analyses CX teams should run**
CX teams get the most value from four types: acquisition, behavioural, predictive, and interaction. The first three sort customers by when or how they arrived. The fourth, interaction cohorts, sorts them by how they prefer to talk to a business, the split most support teams skip.
| **Cohort type** | **Groups customers by** | **Typical CX question it answers** |
| --- | --- | --- |
| **Acquisition cohort** | When and how a customer first engaged | Did customers acquired through a WhatsApp campaign retain better than those from an email campaign the following month? |
| **Behavioral cohort** | An action taken during onboarding or support | Do customers who received a proactive message within two hours of signing up stay longer than those who did not? |
| **Predictive cohort** | Modeled future behavior | Which customers, based on declining message response rates, are likely to churn within 30 days? |
| **Interaction cohort** | Preferred communication channel and depth of engagement | How do lifetime value, satisfaction, and churn differ between customers who mainly use WhatsApp versus live chat versus email? |
The first three are widely covered elsewhere, including in[ Appcues' overview of cohort analysis](https://www.appcues.com/blog/cohort-analysis). The fourth is less commonly discussed but the most useful for a messaging-led support team, since it groups customers by how they prefer to talk to a business, which a signup date alone won't show. This is what a dedicated CX Intelligence layer is built to surface automatically, by[ analysing conversation patterns](/en-sg/blog/ai-text-analysis) across every channel without a manual export.
## **How to run a cohort analysis for customer experience**
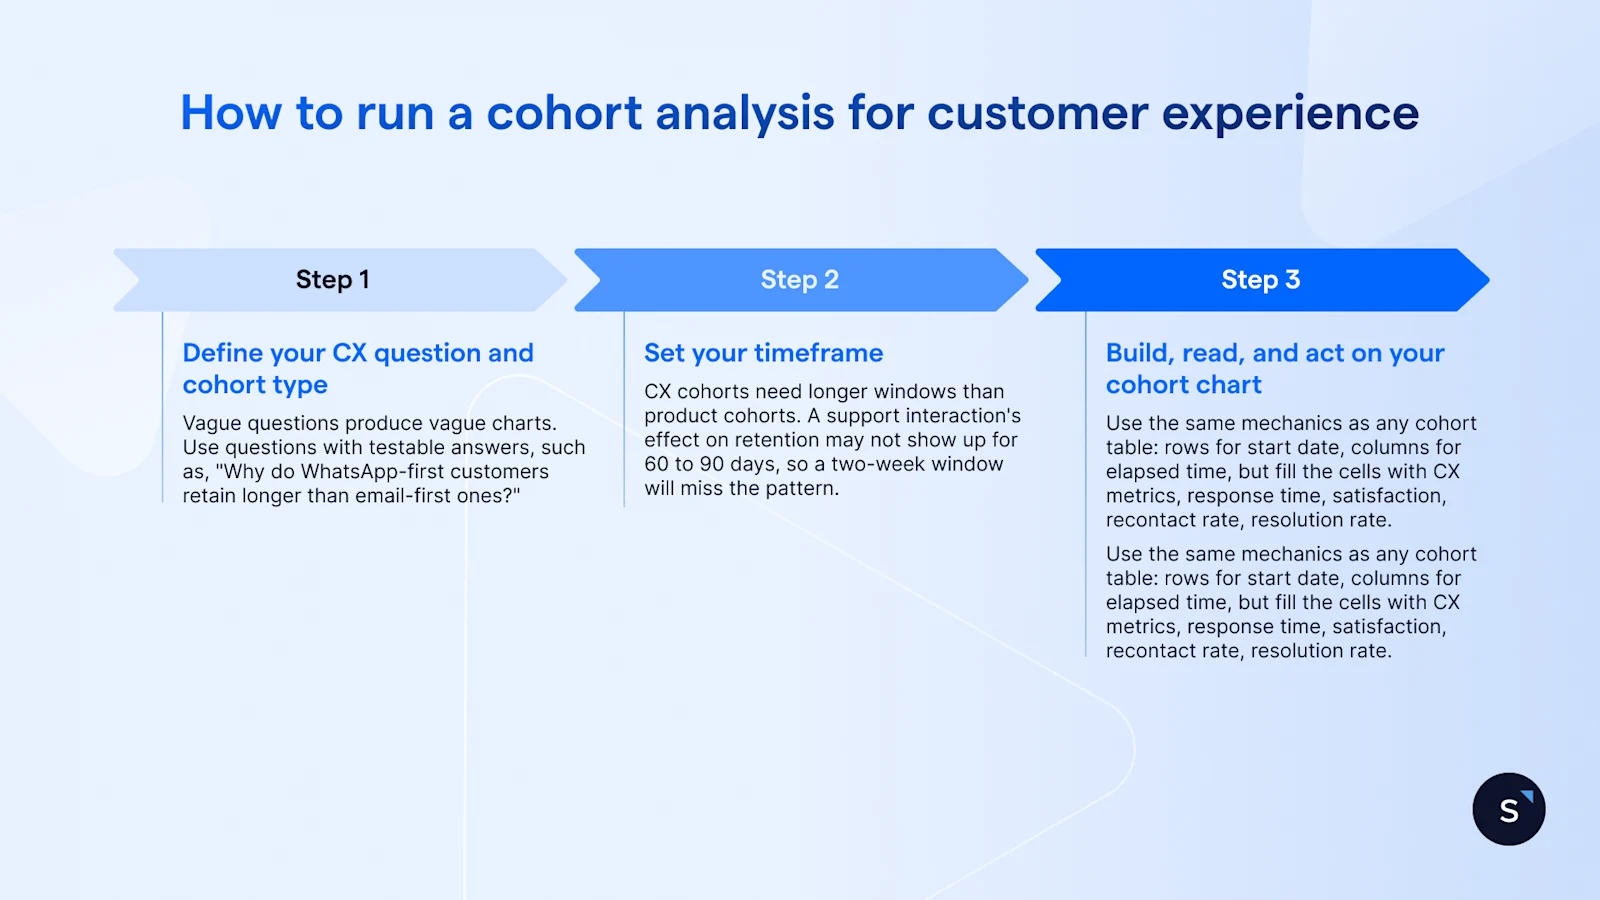
Running one for CX takes three steps: define a CX-specific question and pick the matching cohort type, set a window long enough for a support interaction's effect to show up, then build the chart and act on what it shows. Most teams skip straight to the chart and miss the first step.
### **Step 1: Define your CX question and cohort type**
Vague questions produce vague charts. "Why are customers churning?" is a product question in disguise. "Why do WhatsApp-first customers retain longer than email-first ones?" is a CX question with a testable answer, pointing straight to an acquisition cohort. Use a behavioural cohort for service quality, an interaction cohort for channel preference versus lifetime value.
### **Step 2: Set your timeframe**
CX cohorts often need longer windows than product cohorts. A support interaction's effect on retention may not show up for 60 to 90 days, so a two-week window will miss the pattern.
### **Step 3: Build, read, and act on your cohort chart**
Use the same mechanics as any cohort table: rows for start date, columns for elapsed time, but fill the cells with CX metrics, response time, satisfaction, recontact rate, resolution rate. These aren't arbitrary picks.[ HubSpot's State of Customer Service research](https://blog.hubspot.com/service/customer-service-stats) found that CSAT and retention are the two metrics service pros rank most important to track, with response time close behind. Look for diagonal drops that line up with a known service failure, flattening curves among cohorts with consistent proactive touchpoints, and sharp early drop-offs where no follow-up was sent. Then test the fix on a small group before rebuilding the whole workflow.
## **Cohort analysis best practices for CX teams**
**Segment beyond acquisition date.** Channel, language, region, tier, and issue type reveal patterns a "signup month" view will miss.
**Connect messaging data to customer records.** If WhatsApp conversations and customer records live in separate systems, the signals never connect.
**Automate monitoring at the cohort level.** Flag it immediately if a cohort's 14-day satisfaction score drops below baseline, rather than waiting for a quarterly review.
**Share findings across support, marketing, and product.** An insight that stays inside a support dashboard never changes the onboarding flow that caused the problem.
**Shorten the gap between insight and intervention.** Value is lost in the space between finding the pattern and changing something because of it.
## **Cohort analysis examples for Customer Experience teams**
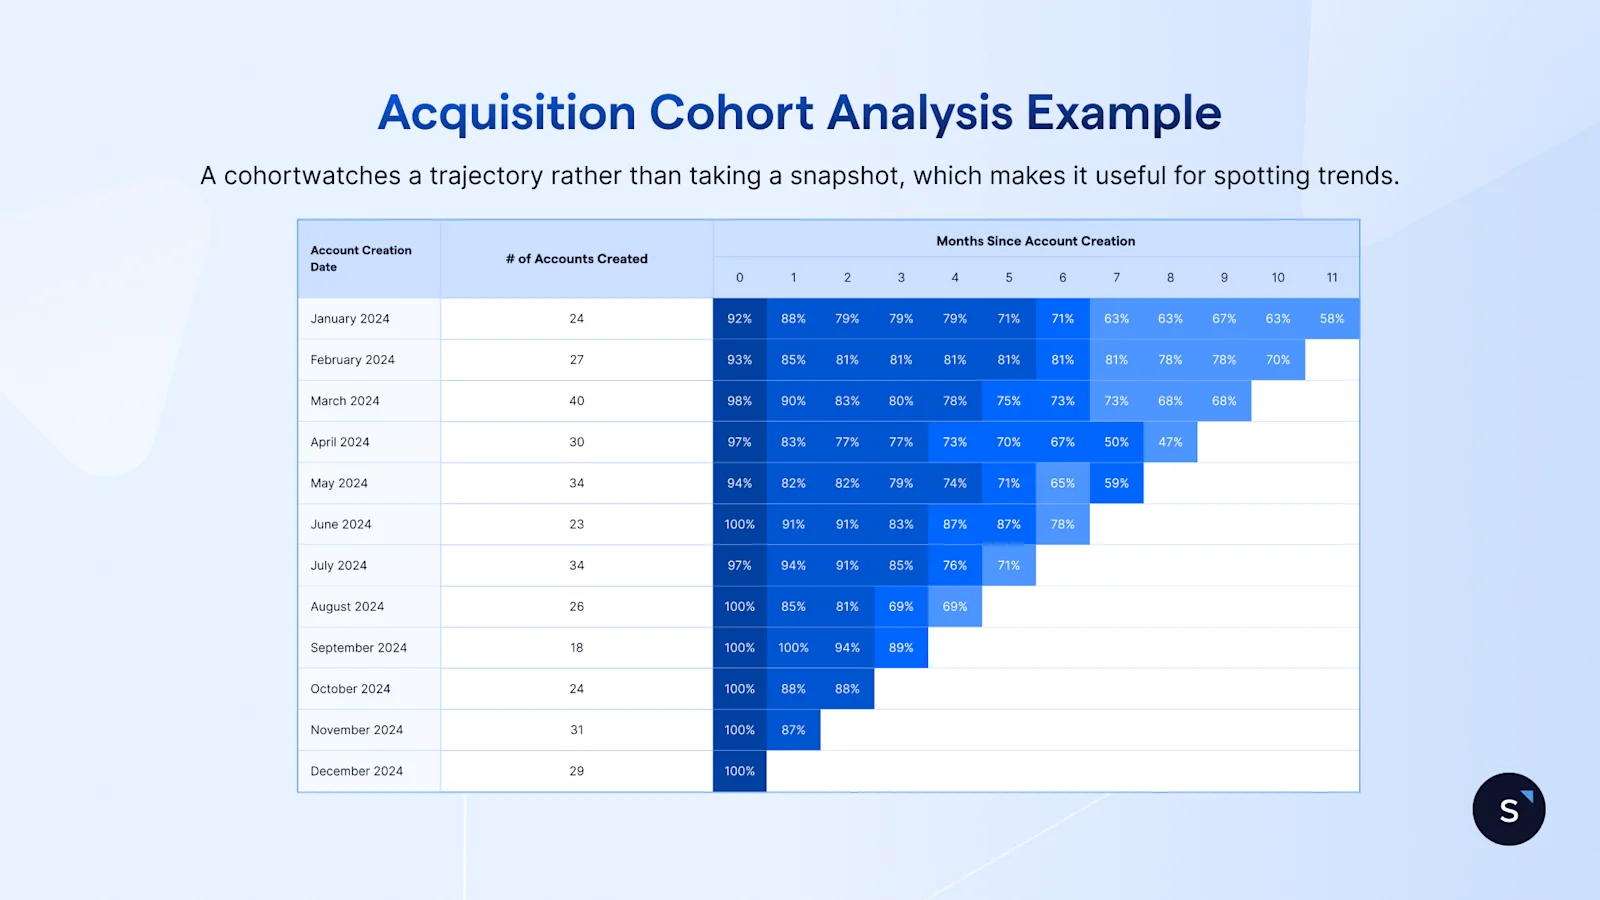
The two scenarios below are illustrative worked examples that show the method, not published results from a named company.
**Example 1: Which channel drives stronger long-term retention?** An acquisition cohort compares customers who first engaged via WhatsApp against those who first engaged via email. If the WhatsApp-first group shows a higher 90-day retention curve, shift first-response investment toward WhatsApp for new customer acquisition.
**Example 2: Diagnosing a support experience that is causing churn.** A behavioural cohort tracks customers who complained in their first 30 days, split by resolution speed. If the quickly resolved cohort retains meaningfully better, set a firm resolution SLA for new accounts and prioritise faster routing for that segment.
For published outcomes rather than illustrative ones, SleekFlow's[ customer stories](/en-sg/customer-stories) page documents how specific businesses have used messaging data to improve retention.
## **How SleekFlow's CX Intelligence Dashboard Helps With Cohort Analysis**
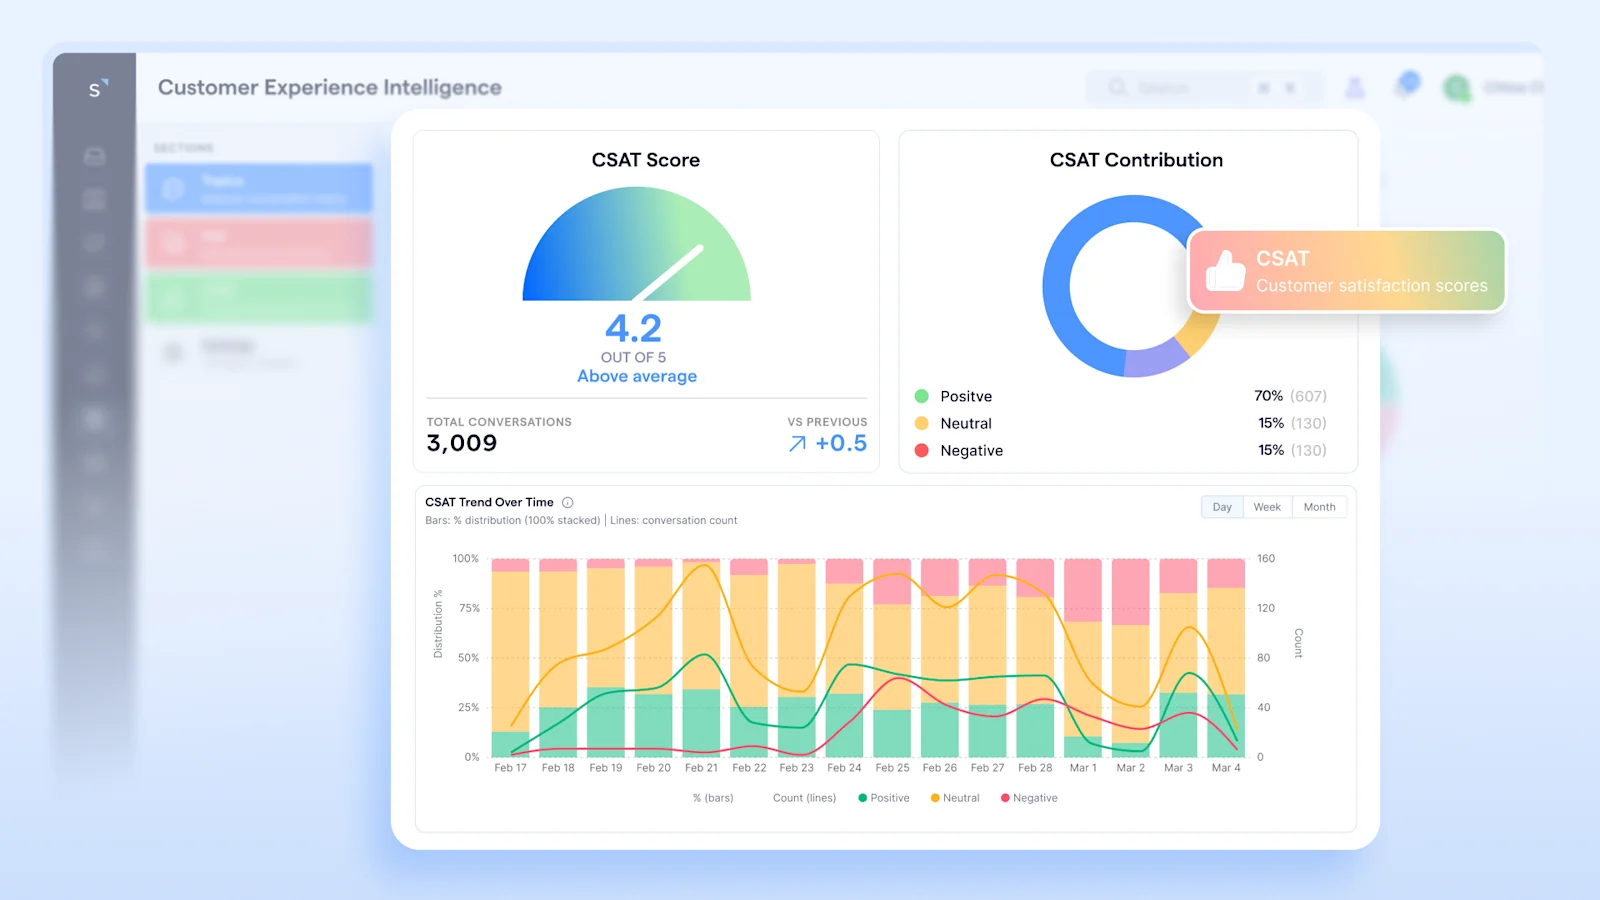
Running this by hand, exporting chats, tagging by channel, and calculating retention by week, works for a one-off audit. It stops working once volume climbs into the thousands of conversations a week.
SleekFlow's [CX Intelligence dashboard](/en-sg/blog/customer-experience-intelligence) analyses conversations across WhatsApp, live chat, and Instagram DM continuously.
It surfaces the topics, sentiment, and root causes behind each interaction without manual tagging, so channel and resolution-speed cohorts build themselves instead of living in a spreadsheet someone has to maintain by hand every week.
Paired with[ AgentFlow's Data Analyst Agent](/en-sg/agentflow), which flags emerging trends and answers plain-language performance questions, a CX team can move from "we think WhatsApp customers retain better" to a confirmed, cohort-backed answer in minutes.
## **Get Started With Cohort Analysis**
A cohort chart only pays off once someone acts on what it shows the same week it's built, not the following quarter. Start with one CX question, one cohort type, and one metric you can pull today. If your conversation data already lives in SleekFlow, the interaction-cohort split is available without a spreadsheet:[ book a short demo](/en-sg/book-a-demo) to see your own channel and resolution-speed cohorts.
## Want to outcompete your peers with SleekFlow's help?
Book your personalised demo with SleekFlow today and unlock the potential of seamless communication
[Book a Demo](https://sleekflow.io/en-sg/book-a-demo)
[View Pricing](https://sleekflow.io/en-sg/pricing)
### What is the difference between cohort analysis and segmentation?
Segmentation groups customers by a static attribute at one point in time, such as industry or plan tier. Cohort analysis adds a time dimension, tracking how a group's behaviour changes after a shared starting event, which is what makes it useful for spotting when a group starts to disengage.
### How is cohort analysis used in customer experience?
CX teams compare retention and recontact rates across groups defined by channel, resolution speed, or onboarding completion, rather than relying on a single aggregate score that hides which experiences drive retention. A team might find that customers resolved within four hours retain far better than those left waiting a day.
### What is an interaction cohort?
An interaction cohort groups customers by preferred communication channel and depth of engagement, then compares lifetime value and churn across those groups. It is the least commonly discussed of the four cohort types, but often the most useful for a messaging-led support team, since it tracks how customers want to talk, which a signup date alone won't show.
### How do you measure retention in a cohort analysis?
Retention is typically the percentage of a cohort still active at fixed intervals after the starting event, for example at 30, 60, and 90 days, paired with service metrics like resolution rate that explain why the curve moved, whether resolution got faster or a specific channel improved.
### What data do you need to run a customer cohort analysis?
A timestamped record of when each customer entered a cohort, plus ongoing activity data. CX analysis also needs conversation-level data, channel, response time, resolution outcome, and satisfaction score, linked to the same customer record. Without that link, a churn number arrives with no explanation attached.
### How often should CX teams run cohort analysis?
Quarterly reviews alone are too slow to catch a service failure before it does lasting damage. Continuous, automated monitoring, with a deeper manual review monthly, works better. Waiting for the quarterly report means three cohorts have already been affected before anyone notices the pattern.