Customer experience analytics: what it is, what to measure, and how to improve CX across every channel

TL; DR: Quick Summary
- Customer experience analytics connects feedback, behaviour, operational data, and business outcomes across every customer touchpoint.
- The most useful starting metrics are first response time, resolution time, CSAT, conversion rate, repeat contact rate, and retention.
- For Singapore teams, messaging channels such as WhatsApp, Instagram, Facebook Messenger, and live chat should sit in the same view as CRM, support, and post-purchase data.
- Strong CX analytics helps teams spot friction early, understand the root cause, and prioritise fixes that improve conversion, resolution, and loyalty.
- Good CX analytics does not stop at reporting. It should lead to better workflows, staffing, content, automation, handoffs, and customer journeys.
In Singapore, customer experience now lives across messaging apps, websites, social media, support queues, and post-purchase journeys, not in one neat funnel. That shift matters because 75% of Singapore consumers expect consistent interactions across departments and 71% prefer fewer touchpoints to get things done. When those experiences feel disconnected, customers notice quickly.
That is why customer experience analytics matters. It helps marketing, sales, support, and operations teams understand not just what happened, but where friction starts, which channels drive better outcomes, and what needs fixing first.
What is customer experience analytics?
Customer experience analytics is the practice of collecting, combining, and analysing customer data across touchpoints so you can understand how people experience your brand and improve that experience with evidence, not guesswork. Leading guides consistently define it around three data types: feedback data, behavioural data, and operational data.
In layman's terms, it means bringing together signals like page exits, onboarding drop-offs, chat response times, complaint themes, survey scores, repeat purchases, and churn risk, then turning them into action.
What counts as customer experience data?
It includes data from:
website behaviour
in-app behaviour
live chat and messaging
WhatsApp, Instagram, and Facebook conversations
email and call centre interactions
CSAT, NPS, and CES surveys
ticketing and resolution data
transaction and retention data
ratings, reviews, and social feedback
This is also why customer experience analytics is not just surveys. Surveys tell you what customers say. Analytics shows what they do, where they struggle, and whether the business fixed the problem.
Why customer experience analytics matters
Customer experience analytics is not just a “nice-to-have”. Analytics provide actionable data that:
Shows where customers feel friction before revenue or loyalty drops.
Helps teams prioritise the moments that affect conversion, resolution, and retention most.
Reduces siloed decision-making between marketing, sales, and support.
Makes it easier to personalise journeys based on actual behaviour, not assumptions.
Improves resource allocation by showing where staffing, automation, or content changes will have the biggest impact.
Gives leadership a clearer link between CX and commercial outcomes.
What data should go into customer experience analytics?
The best programmes combine journey data, conversation data, and business outcome data.
How to analyse customer experience across each touchpoint
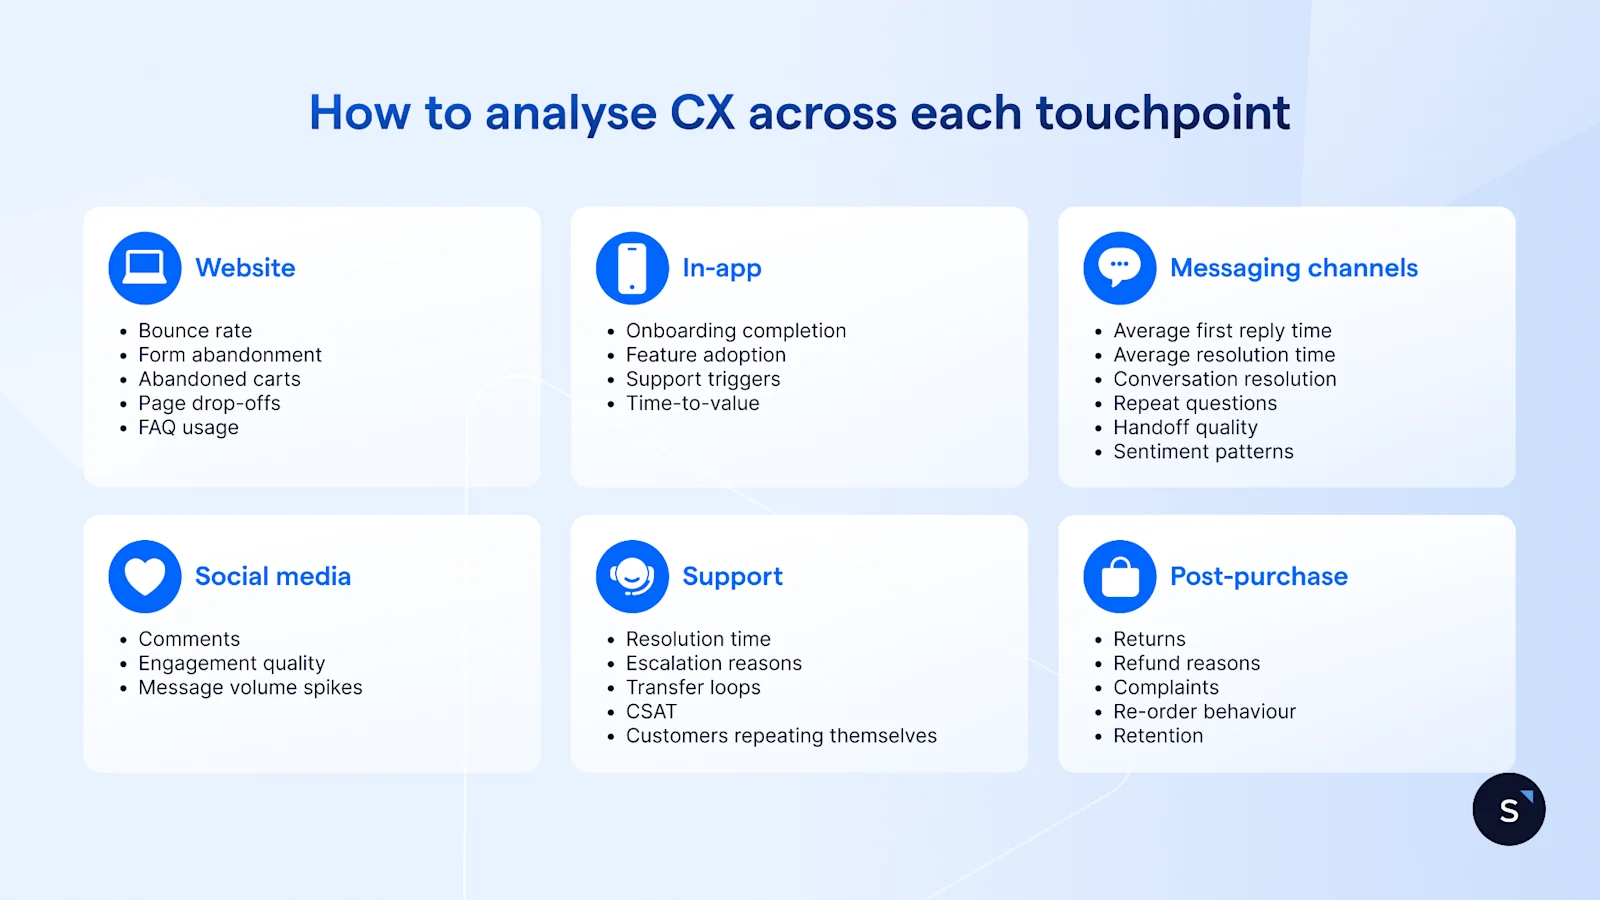
Website
Look at bounce rate, form abandonment, checkout abandonment, product page drop-offs, and FAQ usage. Website analytics shows where intent exists and where confidence breaks. If traffic is strong but conversions are weak, the issue is often friction rather than demand.
In-app or product experience
Track onboarding completion, feature adoption, support triggers, and time-to-value. This is where product friction often hides before it becomes a support issue or a churn issue.
Messaging channels
For WhatsApp, Instagram, Messenger, and live chat, focus on average first reply time, average resolution time, conversation resolution, repeat questions, handoff quality, and sentiment patterns. Messaging is especially important in Singapore because customers already expect quick, connected experiences on the channels they use daily.
Social media
Analyse comments, Engagement quality, and message volume spikes. Social often surfaces the same operational problems before they appear clearly in support reporting.
Support channels
Measure resolution time, escalation reasons, transfer loops, post-resolution CSAT, and whether customers had to repeat themselves. If customers keep coming back for the same issue, your first fix was not a real fix.
Post-purchase
Look at returns, refund reasons, complaint themes, re-order behaviour, repeat purchase, and retention. Post-purchase analytics is where you learn whether the experience actually earns loyalty.
How to turn customer experience data into action
Detect the problem: Start with the metric that clearly signals friction: rising repeat contacts, falling CSAT, slower replies, or weaker retention.
Segment the issue: Break it down by channel, journey stage, campaign source, product line, or customer type.
Inspect the conversations and behaviour behind the number: Do not stop at dashboard trends. Read the actual chat transcripts, complaint themes, and session patterns.
Identify root causes: Is the problem content, workflow, staffing, policy, product design, or handoff quality?
Fix the operating issue: Update the FAQ, shorten the form, change routing, improve handoff notes, automate a reminder, or refine agent training.
Remeasure after the change: Compare before and after by channel and customer segment, not just at the total-account level.
What to look for in a customer experience analytics tool
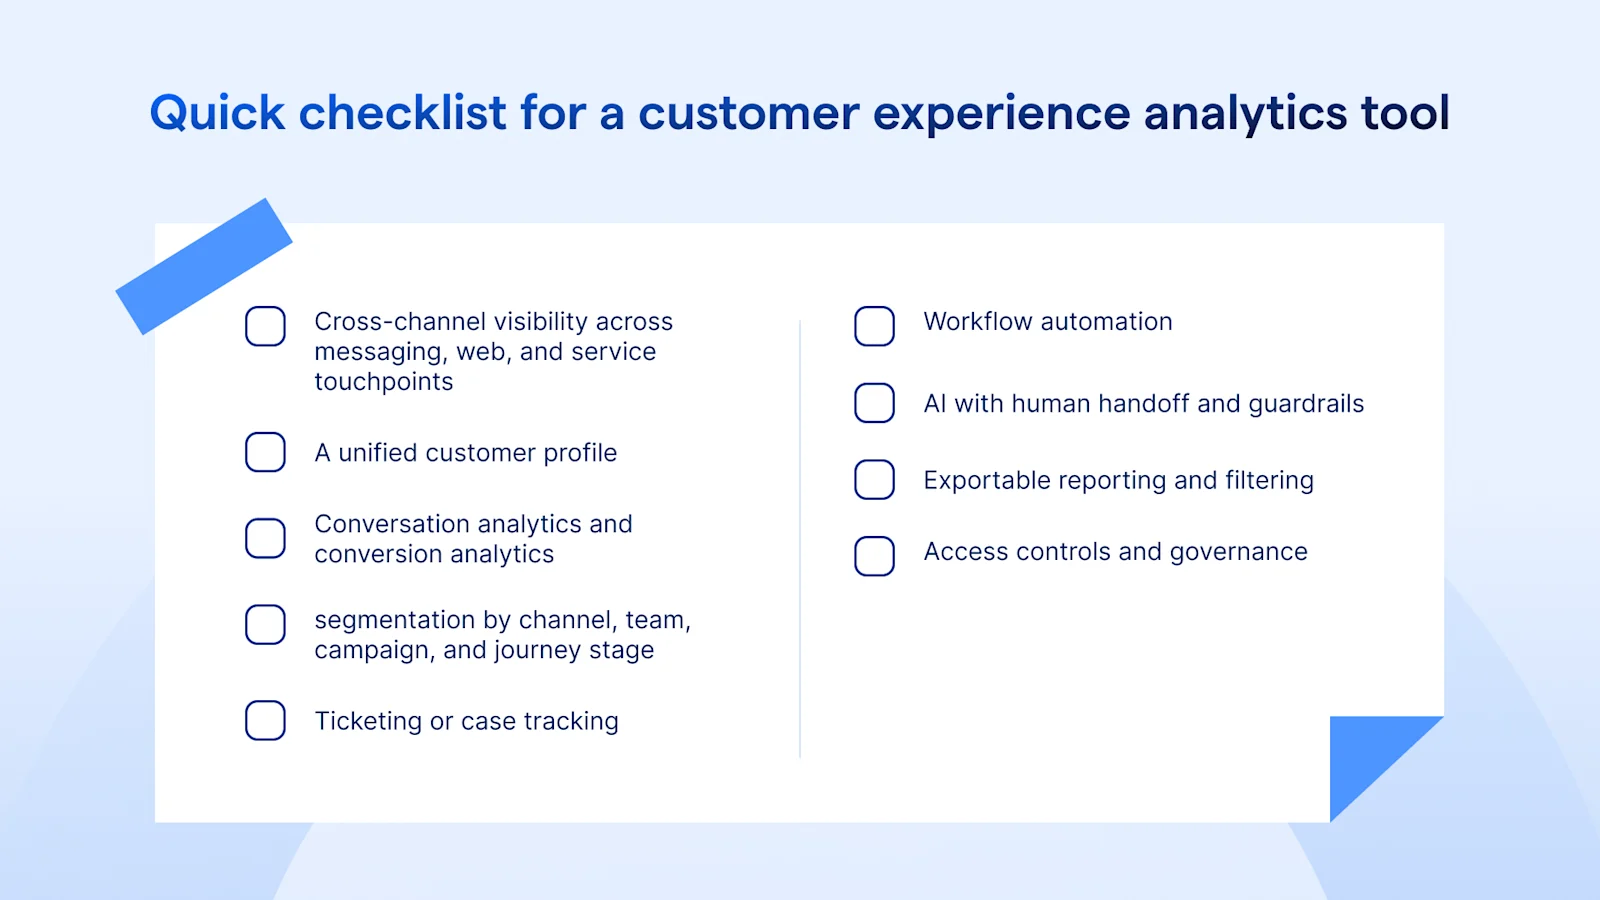
Choose a platform that gives you:
cross-channel visibility across messaging, web, and service touchpoints
a unified customer profile
conversation analytics and conversion analytics
segmentation by channel, team, campaign, and journey stage
ticketing or case tracking
workflow automation
AI with human handoff and guardrails
exportable reporting and filtering
access controls and governance
That matters because the strongest tools do more than count tickets or survey scores. They connect channels, customer context, automation, and outcomes.
Best tool for your customer experience analytics needs
If your customer experience spans lead generation, messaging, support, and post-purchase journeys, SleekFlow is the best fit. It is built for teams that need to measure and improve CX across WhatsApp, Instagram, Facebook Messenger, and live chat while keeping customer context, automation, and conversion tracking in one operating layer. That matters because fragmented tools rarely show the full customer journey clearly enough to improve it.
If your organisation is mostly focused on classic support-ticket reporting, Zendesk is strong on service metrics such as CES, NPS, CSAT, and resolution reporting. If your team is heavily centred.


