Customer insights and analytics: How to turn customer data into better decisions, experiences, and growth

TL; DR: Quick Summary
- Customer analytics tells you what customers are doing; customer insights explain why. Both are needed to drive action.
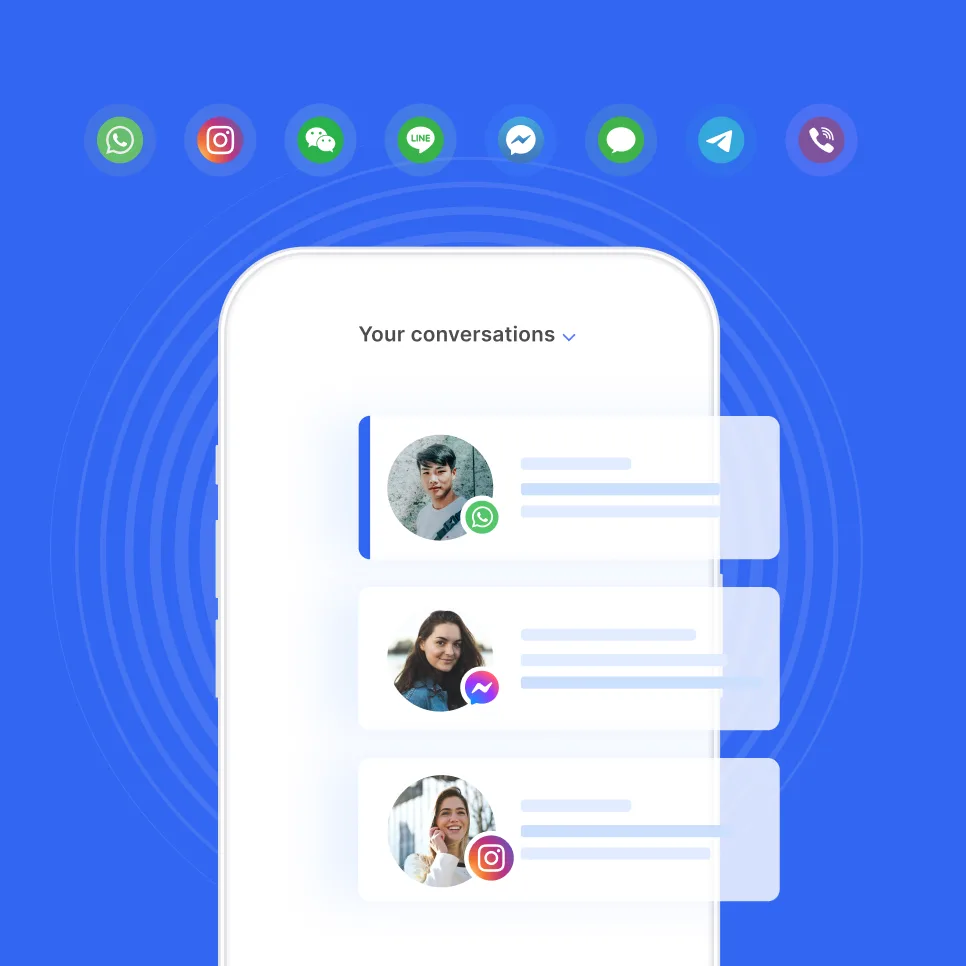
- The most underused source of customer intelligence is already in your inbox: conversation data from WhatsApp, Instagram, and live chat.
- AI speeds up pattern detection and sentiment analysis, but human judgment is still needed to interpret business context and prioritise action.
- Most analytics failures come from one root cause: collecting data without a decision framework in place first.
- Dashboard design should match the decision-maker, not the data source. Executive, marketing, support, and product teams each need different views.
Customer insights and analytics is the practice of collecting, unifying, and analysing customer data to understand behaviour, motivations, and needs, then translating those findings into decisions that improve experience and drive growth.
Most Singapore businesses have more data than they can act on. The problem isn't collection; it's interpretation. Raw numbers tell you what happened. Customer insights tell you why, and what to do next.
What are customer insights and analytics?
Customer analytics focuses on collecting and interpreting measurable data: purchase frequency, session duration, channel engagement, churn rate, response time. It answers the question: what are customers doing?
Customer insights go one layer deeper. They apply human interpretation to that data to surface the motivations, frustrations, and unmet needs behind the numbers. Analytics tells you that 34% of users abandon checkout at step three. Customer insights tell you why — perhaps the payment options are confusing, or the shipping timeline creates hesitation.
Together, customer insights and analytics form a continuous loop: data surfaces patterns, interpretation explains them, action changes the experience, and measurement confirms whether it worked.
Why customer insights and analytics matter
Forrester research shows that companies with strong customer experience strategies see 1.5 times higher revenue growth than those that don't prioritise it. For Singapore businesses dealing with sophisticated, multi-channel customers, the stakes are higher still: 81% of service professionals in Singapore say customers are more demanding than ever, and 65% expect case volumes to climb.
The gap, however, is in execution. A McKinsey survey found that only 15% of CMOs consistently incorporate customer insight into strategic decisions, despite the vast majority ranking customer feedback as an important source of growth ideas. The data exists. The analytical capability is improving. The failure point is turning findings into decisions.
That is exactly what a disciplined customer insights and analytics approach fixes.
Where customer insights come from
Customer data doesn't live in one place. A realistic picture of your customers requires pulling from at least several of these sources simultaneously:
The limitation of surveys deserves separate mention. Pew Research Center data shows response rates dropped from 36% in 1997 to just 6% by 2018, and the decline has continued. The customers who do respond are typically at the extremes — very happy or very frustrated. The majority, who hold nuanced, commercially relevant opinions, rarely complete a survey. They say plenty, however, in chat.
How customer insights and analytics work, step by step
A working customer data analytics pipeline has six stages. Most failures occur not because a stage is technically broken, but because teams skip the middle ones.
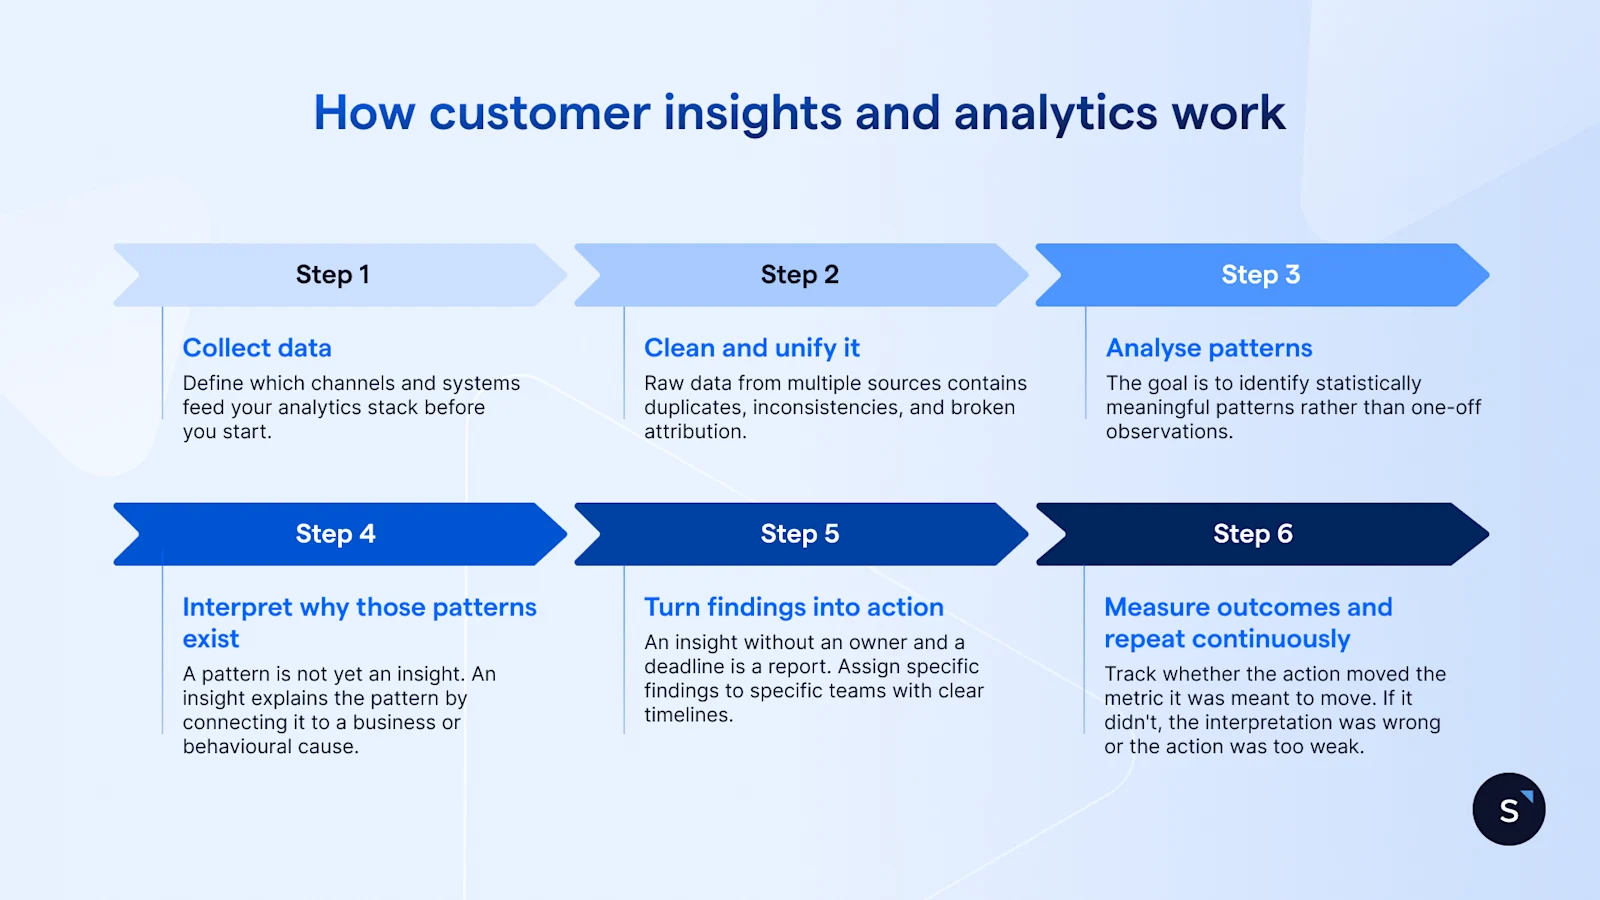
Collect data
Define which channels and systems feed your analytics stack before you start. This includes your messaging inbox, e-commerce platform, contact database, support tool, and any behavioural tracking in place. Gaps in the collection create blind spots that compounding analysis can't fix.
Clean and unify it
Raw data from multiple sources contains duplicates, inconsistencies, and broken attribution. A customer who contacted you on WhatsApp and later made a purchase via your website is one customer, not two data points. Unification, linking identities across channels, is the step that makes journey analysis possible.
Analyse patterns
This is where quantitative methods come in: segmentation, cohort analysis, funnel drop-off analysis, response time tracking, theme clustering. The goal is to identify statistically meaningful patterns rather than one-off observations.
Interpret why those patterns exist
This is the step most teams skip. A pattern (e.g. high cart abandonment on Thursday evenings) is not yet an insight. An insight explains the pattern by connecting it to a business or behavioural cause (e.g. customers defer purchases until payday, or a promotional banner goes live on Thursdays and creates confusion). Interpretation requires human judgment.
Turn findings into actions
An insight without an owner and a deadline is a report. Assign specific findings to specific teams with clear timelines. The action could be a product change, a new automation workflow, a revised message template, or a staffing adjustment. Specify the expected outcome before you ship.
Measure outcomes and repeat continuously
Track whether the action moved the metric it was meant to move. Close the loop. If it didn't, the interpretation was wrong or the action was too weak. Feed that finding back into the next analysis cycle.
Core methods used in customer insights and analytics
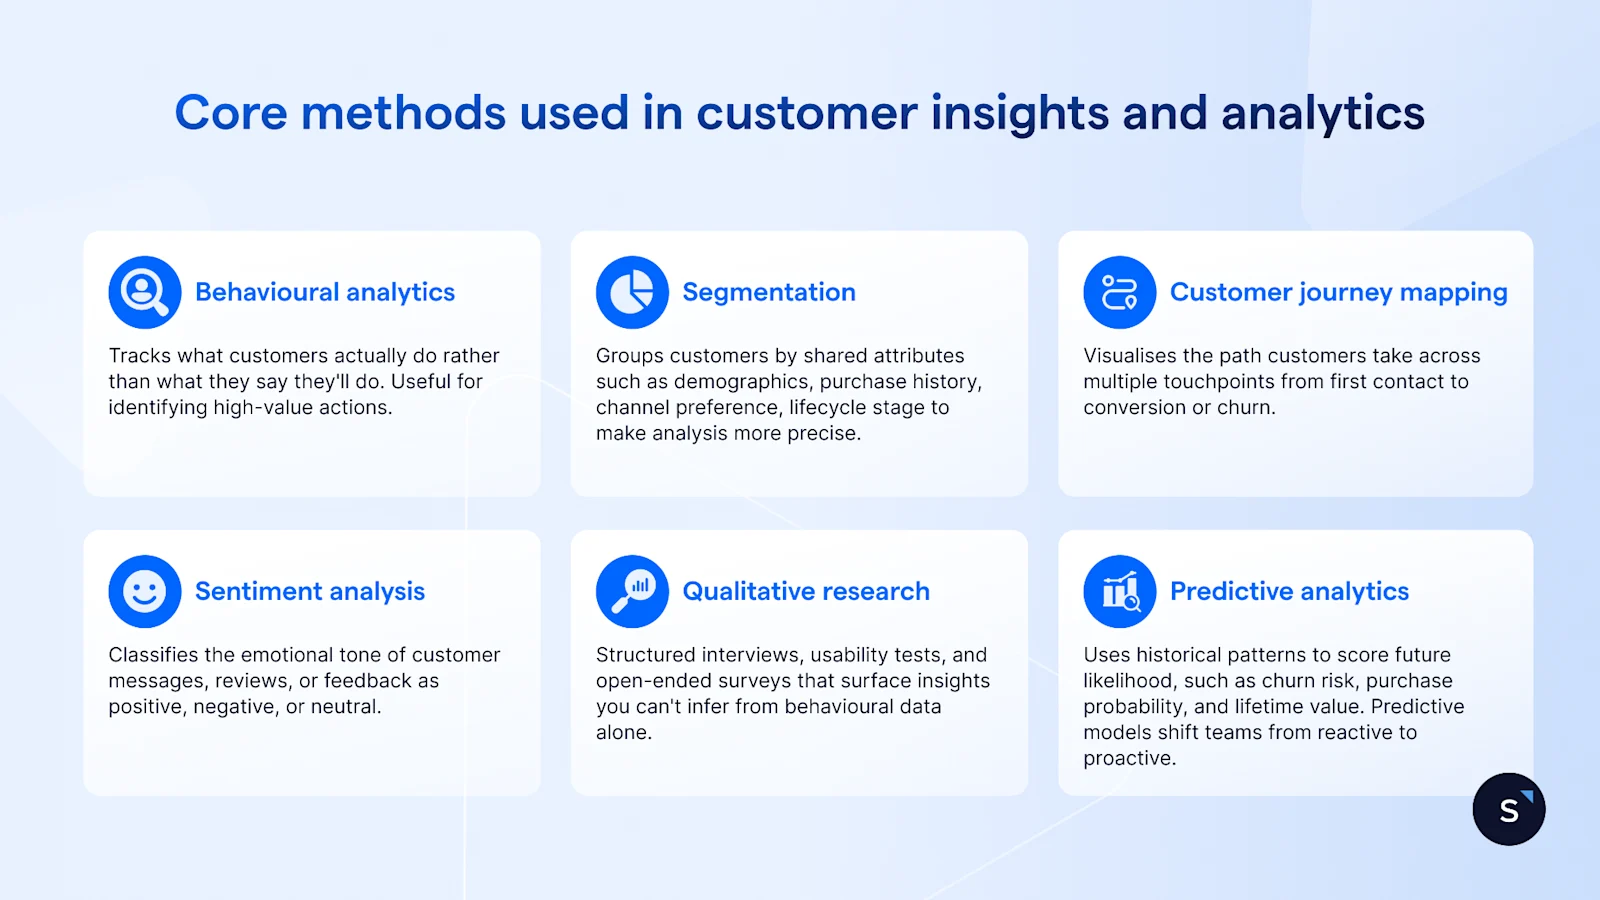
Behavioural analytics
Tracks what customers actually do rather than what they say they'll do. Useful for identifying high-value actions (adding to cart, starting a chat, clicking a CTA) and drop-off points. Behavioural data is the most reliable leading indicator of intent.
Segmentation
Groups customers by shared attributes such as demographics, purchase history, channel preference, lifecycle stage to make analysis more precise. Generic averages hide the behaviour of your most valuable segments.
Customer journey mapping
Visualises the path customers take across multiple touchpoints from first contact to conversion or churn. The value is in identifying friction: moments where customers disengage, repeat themselves, or escalate. Journey maps built from real data (rather than assumed ideal states) are particularly revealing.
Sentiment analysis
Classifies the emotional tone of customer messages, reviews, or feedback as positive, negative, or neutral. Modern AI-based sentiment tools handle sarcasm, mixed sentiment, and contextual nuance better than older keyword-matching approaches.
Qualitative research
Structured interviews, usability tests, and open-ended surveys that surface motivations and mental models you can't infer from behavioural data alone. Qualitative research is slower but generates hypotheses that quantitative analysis can then test at scale.
Predictive analytics
Uses historical patterns to score future likelihood, such as churn risk, purchase probability, and lifetime value. Predictive models shift teams from reactive (responding to problems after they occur) to proactive (intervening before the customer disengages). The accuracy of any predictive model depends on the quality and volume of the historical data feeding it.
How AI is changing customer insights and analytics
AI has materially changed four parts of the analytics workflow, and one important thing remains unchanged.
What AI accelerates:
Pattern detection: AI processes large conversation and behavioural datasets in minutes, surfacing recurring themes without manual tagging.
Sentiment and theme extraction: Models now classify intent, detect frustration signals, and cluster complaints by topic automatically.
Predictive scoring: Churn risk, purchase intent, and escalation likelihood can be calculated in real time rather than in weekly batch reports.
Natural-language queries: Teams can ask questions of their data in plain language and receive answers without writing a SQL query.
What AI doesn't change:
AI speeds up analysis, but teams still need human judgment to interpret business context and decide what action to take. A model can tell you that 22% of this week's WhatsApp messages express hesitation about delivery time. It can't tell you whether to fix your logistics, adjust your messaging, or offer a discount. That decision requires understanding your margins, your supplier constraints, and your brand positioning. The human judgment layer cannot be automated away.
CX Today's 2026 CA&I Buyer's Guide summarises this well: the market has moved from "having dashboards" to actually knowing what's happening, why, and what to do next. The gap between the two is not a technology problem — it's an interpretation and execution problem.
Why conversation data is one of the richest customer insight sources
Most businesses already have a significant insight asset they're barely using: their customer conversations.
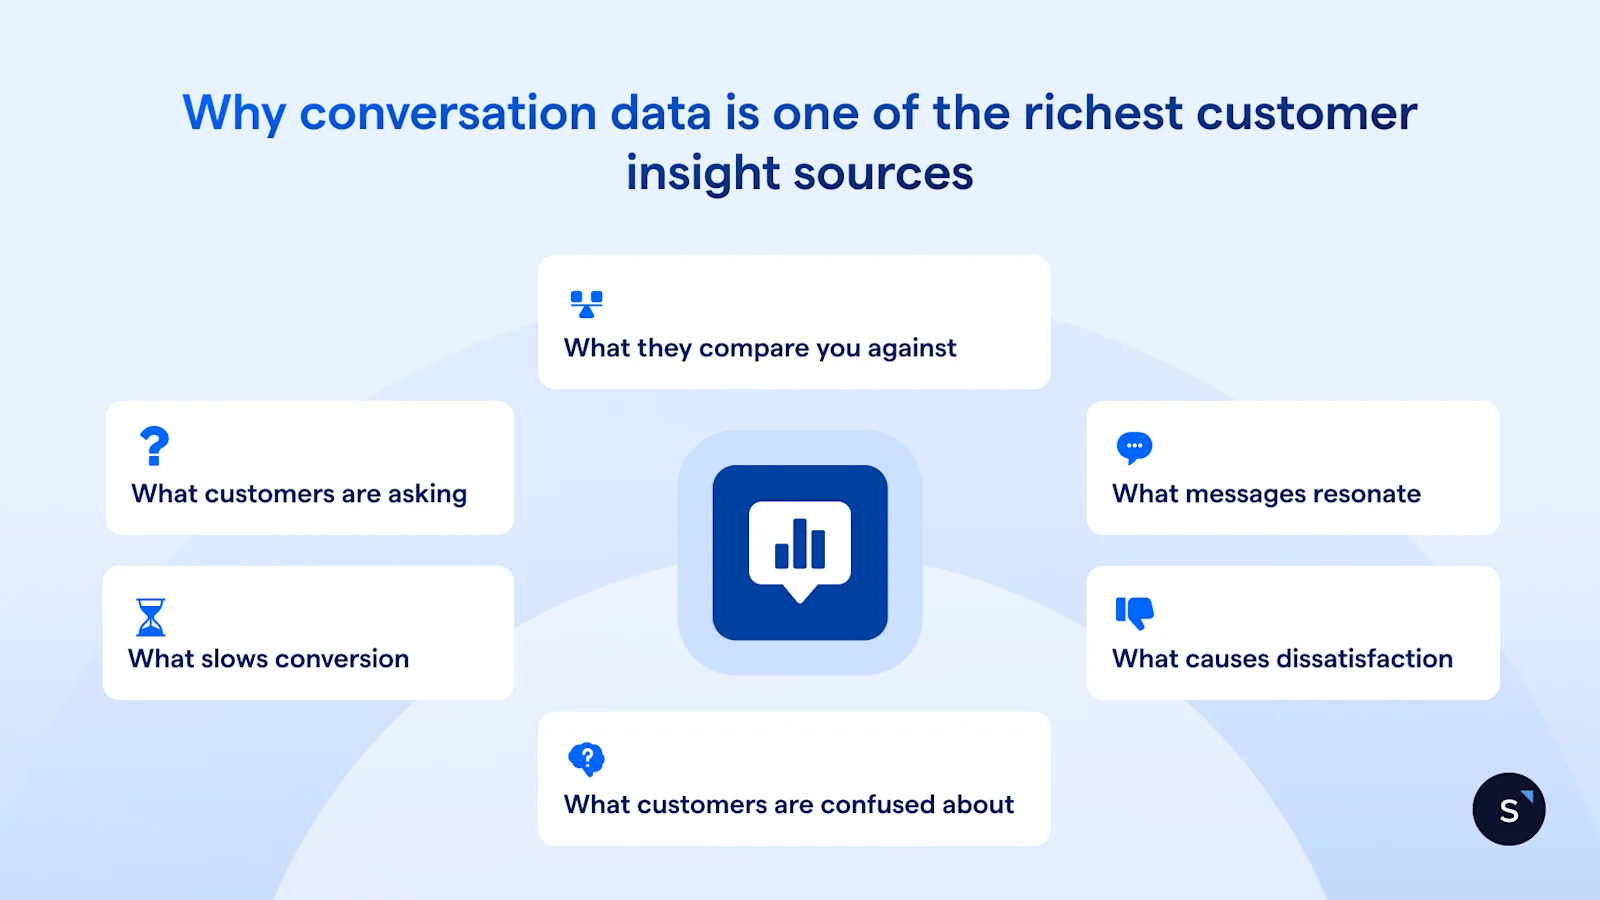
WhatsApp, Instagram DMs, Facebook Messenger, and live chat transcripts contain six types of commercially valuable signals that surveys rarely capture:
What customers are asking — the actual questions, in their own language, not the categories your team created.
What they're confused about — repeated questions on the same topic signal unclear messaging or a product gap.
What they compare you against — customers' names, competitors and describe the comparison criteria unprompted.
What slows conversion — hesitation language ("not sure yet," "let me check") pinpoints friction in the purchase decision.
What causes dissatisfaction — complaints made in conversation are typically more specific and actionable than NPS verbatims.
What messages resonate — high-conversion conversations share patterns: tone, offer structure, response speed.
The insight is already there. The barrier is extracting it at scale without manual review of thousands of threads.
Common mistakes in customer insights and analytics
These are the failure modes that produce expensive dashboards and no change in customer behaviour.
The most common root cause is the first one. Teams build their analytics stack before agreeing on which decisions it needs to support. Fix the decision framework first, then design the data collection around it.
What a customer insights dashboard actually looks like in practice
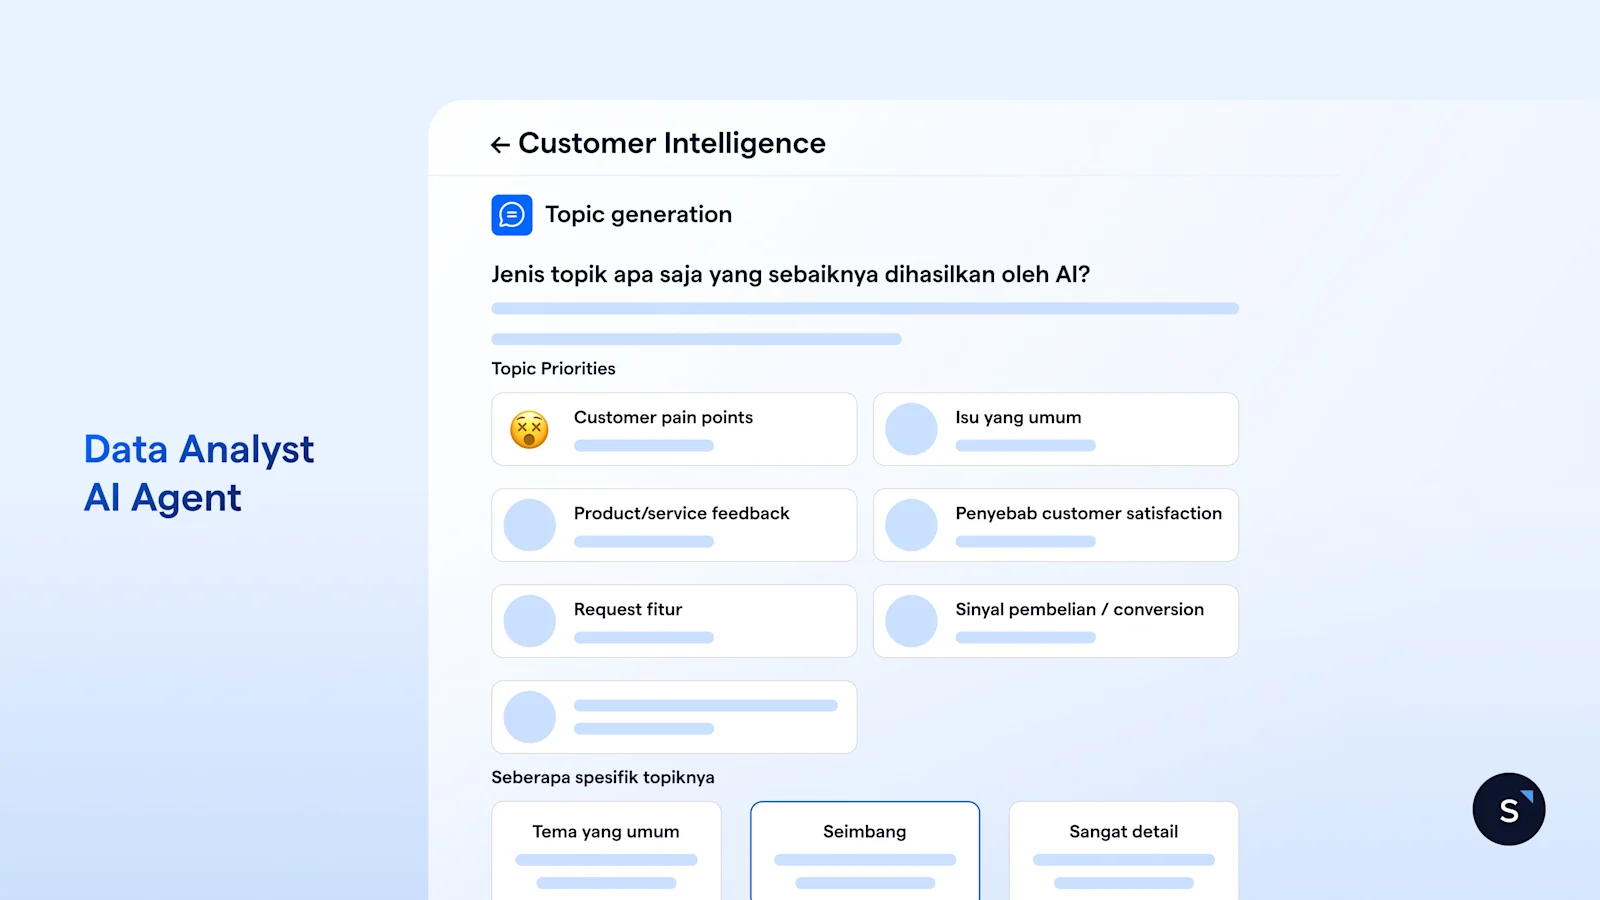
The gap between "we have data" and "we make better decisions" usually comes down to which views your team is actually working from each day. SleekFlow's CX Intelligence gives teams three distinct lenses on their customer conversations.
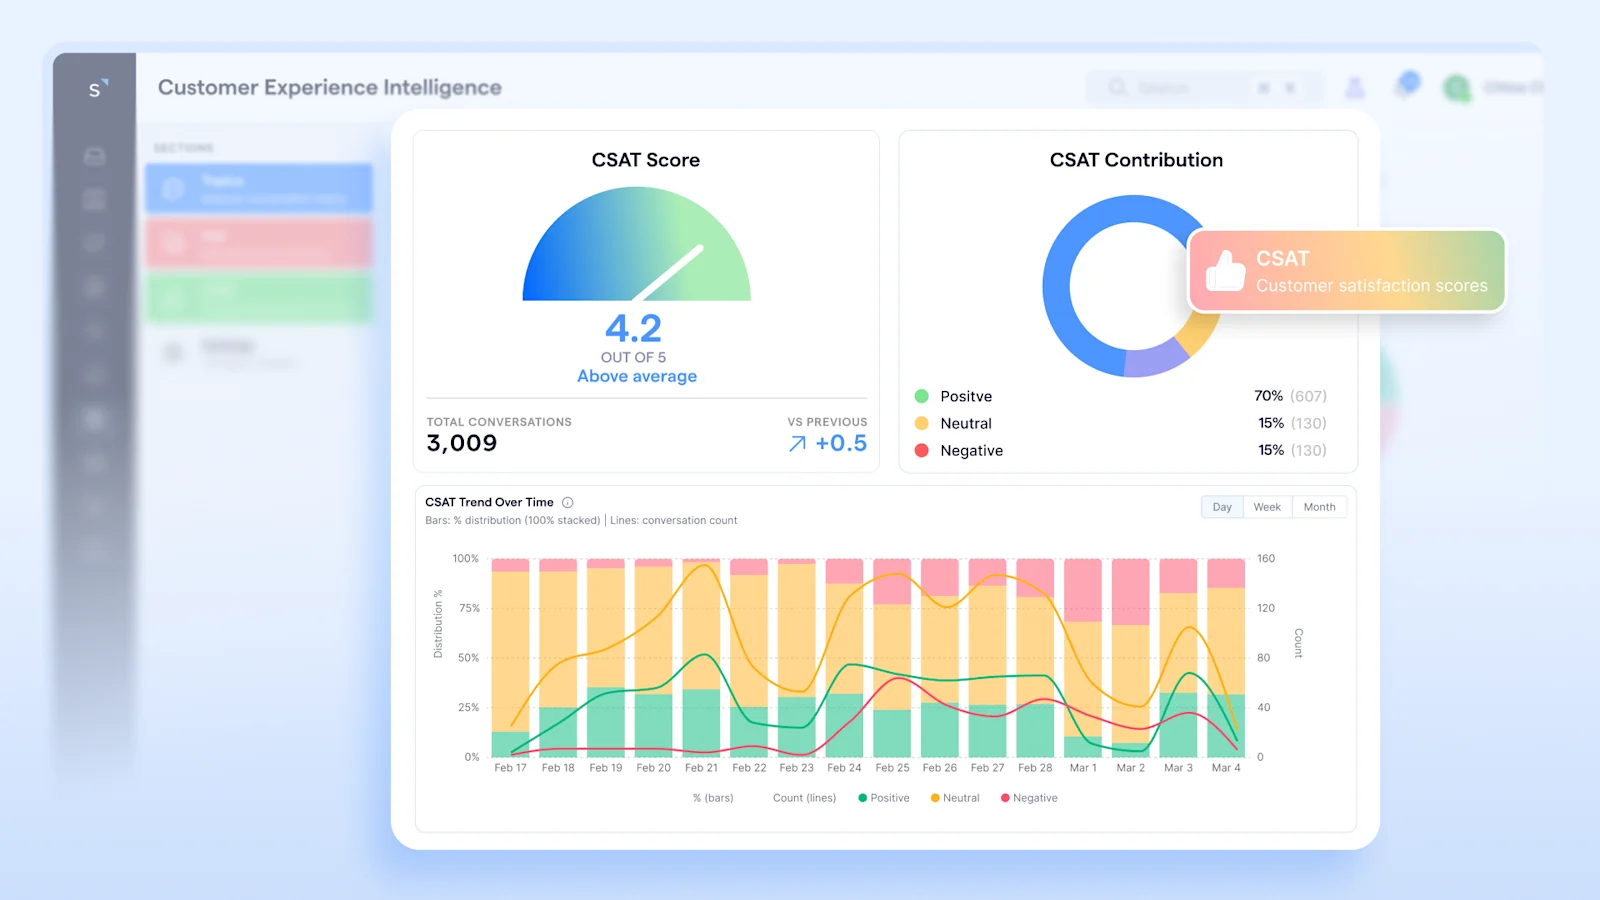
CX Intelligence
This is the layer that replaces manual tagging and survey analysis. CX Intelligence automatically surfaces AI customer insights from every conversation — no manual work required. Rather than waiting for a quarterly survey or digging through transcripts, teams get a continuously updated picture of what customers are saying, what's causing friction, and where opportunities are emerging.
The key distinction from operational dashboards: CX Intelligence reads the substance of conversations, not just the metadata. It tells you what customers are talking about and why, not just how many messages were sent.
Topic Analytics
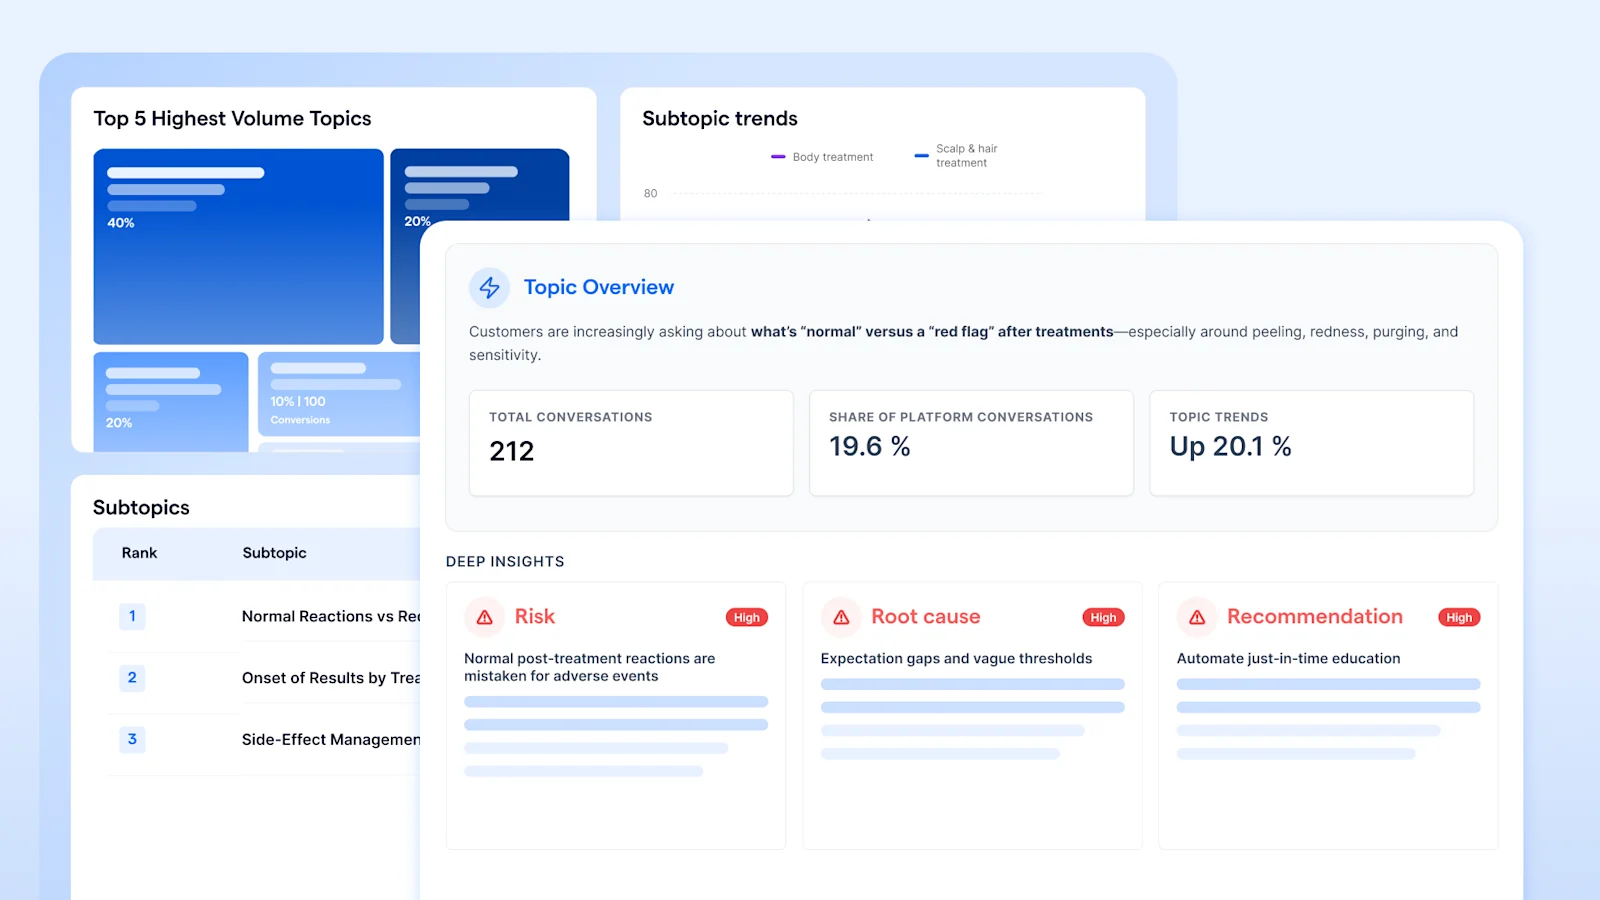
Topic Analytics is where teams define what they want to track and then measure it at scale. Each topic is set up with a name (e.g. "Refund requests," "Delivery concerns," "Pricing questions") and a set of criteria — the phrases customers actually use in conversation. Once configured, the dashboard tracks how frequently each topic appears, how it trends over time, and which segments are driving it.
The practical value is in specificity. A broad topic like "Post-sales support" can be broken down into distinct intents — "damaged item," "tracking issue," "refund dissatisfaction" — so support, sales, and marketing teams each see exactly the signal that's relevant to their decisions, rather than an undifferentiated pile of conversation volume.
Topics also serve a strategic function: they surface patterns you didn't already know to look for. Teams regularly discover recurring customer concerns they had no visibility into because no one thought to ask about them in a survey.
Conversation Analytics Dashboard
This view covers inbox performance and team efficiency. The key metrics are message volume by channel and period, average first reply time and resolution time, contact growth, and broadcast performance. For operations and team managers, this is the view that answers day-to-day staffing and workload questions: are response times within target, which channels are busiest, and where is the team falling behind?
Used alongside CX Intelligence and Topic Analytics, the Conversation Analytics Dashboard closes the loop — it tells you whether operational improvements (faster replies, better routing, additional headcount) are actually reducing the friction your insights identified.
Frequently Asked Questions
What is the difference between customer insights and customer analytics?
Where do customer insights come from?
What tools are used for customer insights and analytics?
How do customer insights improve marketing?
How do customer insights help reduce churn?
What is the role of AI in customer insights?
How do you build a customer insights strategy?
Want to outcompete your peers with SleekFlow's help?
Book your personalised demo with SleekFlow today and unlock the potential of seamless communication
Recommended for you


